
Bitcoin traders are rebuilding bets on a move toward $80,000 as easing geopolitical tensions, firmer institutional demand, and a rebound above $70,000 revive appetite for upside exposure after weeks of defensive positioning.
On Coinbase-owned Deribit, the largest venue for crypto options, the $80,000 call has become the single biggest strike by open interest this week, with around $1.5 billion tied up in contracts that pay off if Bitcoin rises above that level.
This is also evident on the on-chain options platform, Derive, where open interest at the $85,000 strike has climbed to about $60 million, while $100,000 calls stand near $45 million.
The shift marks a notable change in tone after a stretch in which traders spent much of their energy buying protection against another leg lower.
However, Bitcoin has since recovered from early-week lows near $67,000, trading above $70,000, helped by a temporary ceasefire between the US and Iran that eased pressure on oil and steadied broader risk sentiment.
Nonetheless, the market has not fully let its guard down, as downside protection remains bid across longer maturities, and parts of the futures market continue to lean defensive.
Options traders rotate back to upside
The strongest evidence of improved market sentiment has come from traders reworking their positions after the ceasefire announcement.
On April 8, Deribit Insights revealed that one of the dominant structures into Easter involved buying April 24 puts at the $61,000 and $62,000 strikes, a sign that investors were still preparing for a deeper washout.
However, after the geopolitical headlines improved, those positions were rolled up on a premium-neutral basis into the $65,000 and $66,000 strikes, cutting downside notional by more than half.
At the same time, traders bought an April 10 call condor spanning $74,000 to $80,000 to position for near-term upside.
That repositioning was also reflected in the options surface. In maturities of less than seven days, skew moved from favoring puts toward a flatter profile as demand for calls returned. Implied volatility, which had firmed into the Trump deadline, held up even as prices rallied, allowing long-gamma holders to exit positions with gains tied to both price direction and volatility.

Glassnode said volatility compression has deepened across the curve, with front-end implied volatility dropping into the low 40s as immediate stress pricing unwinds.
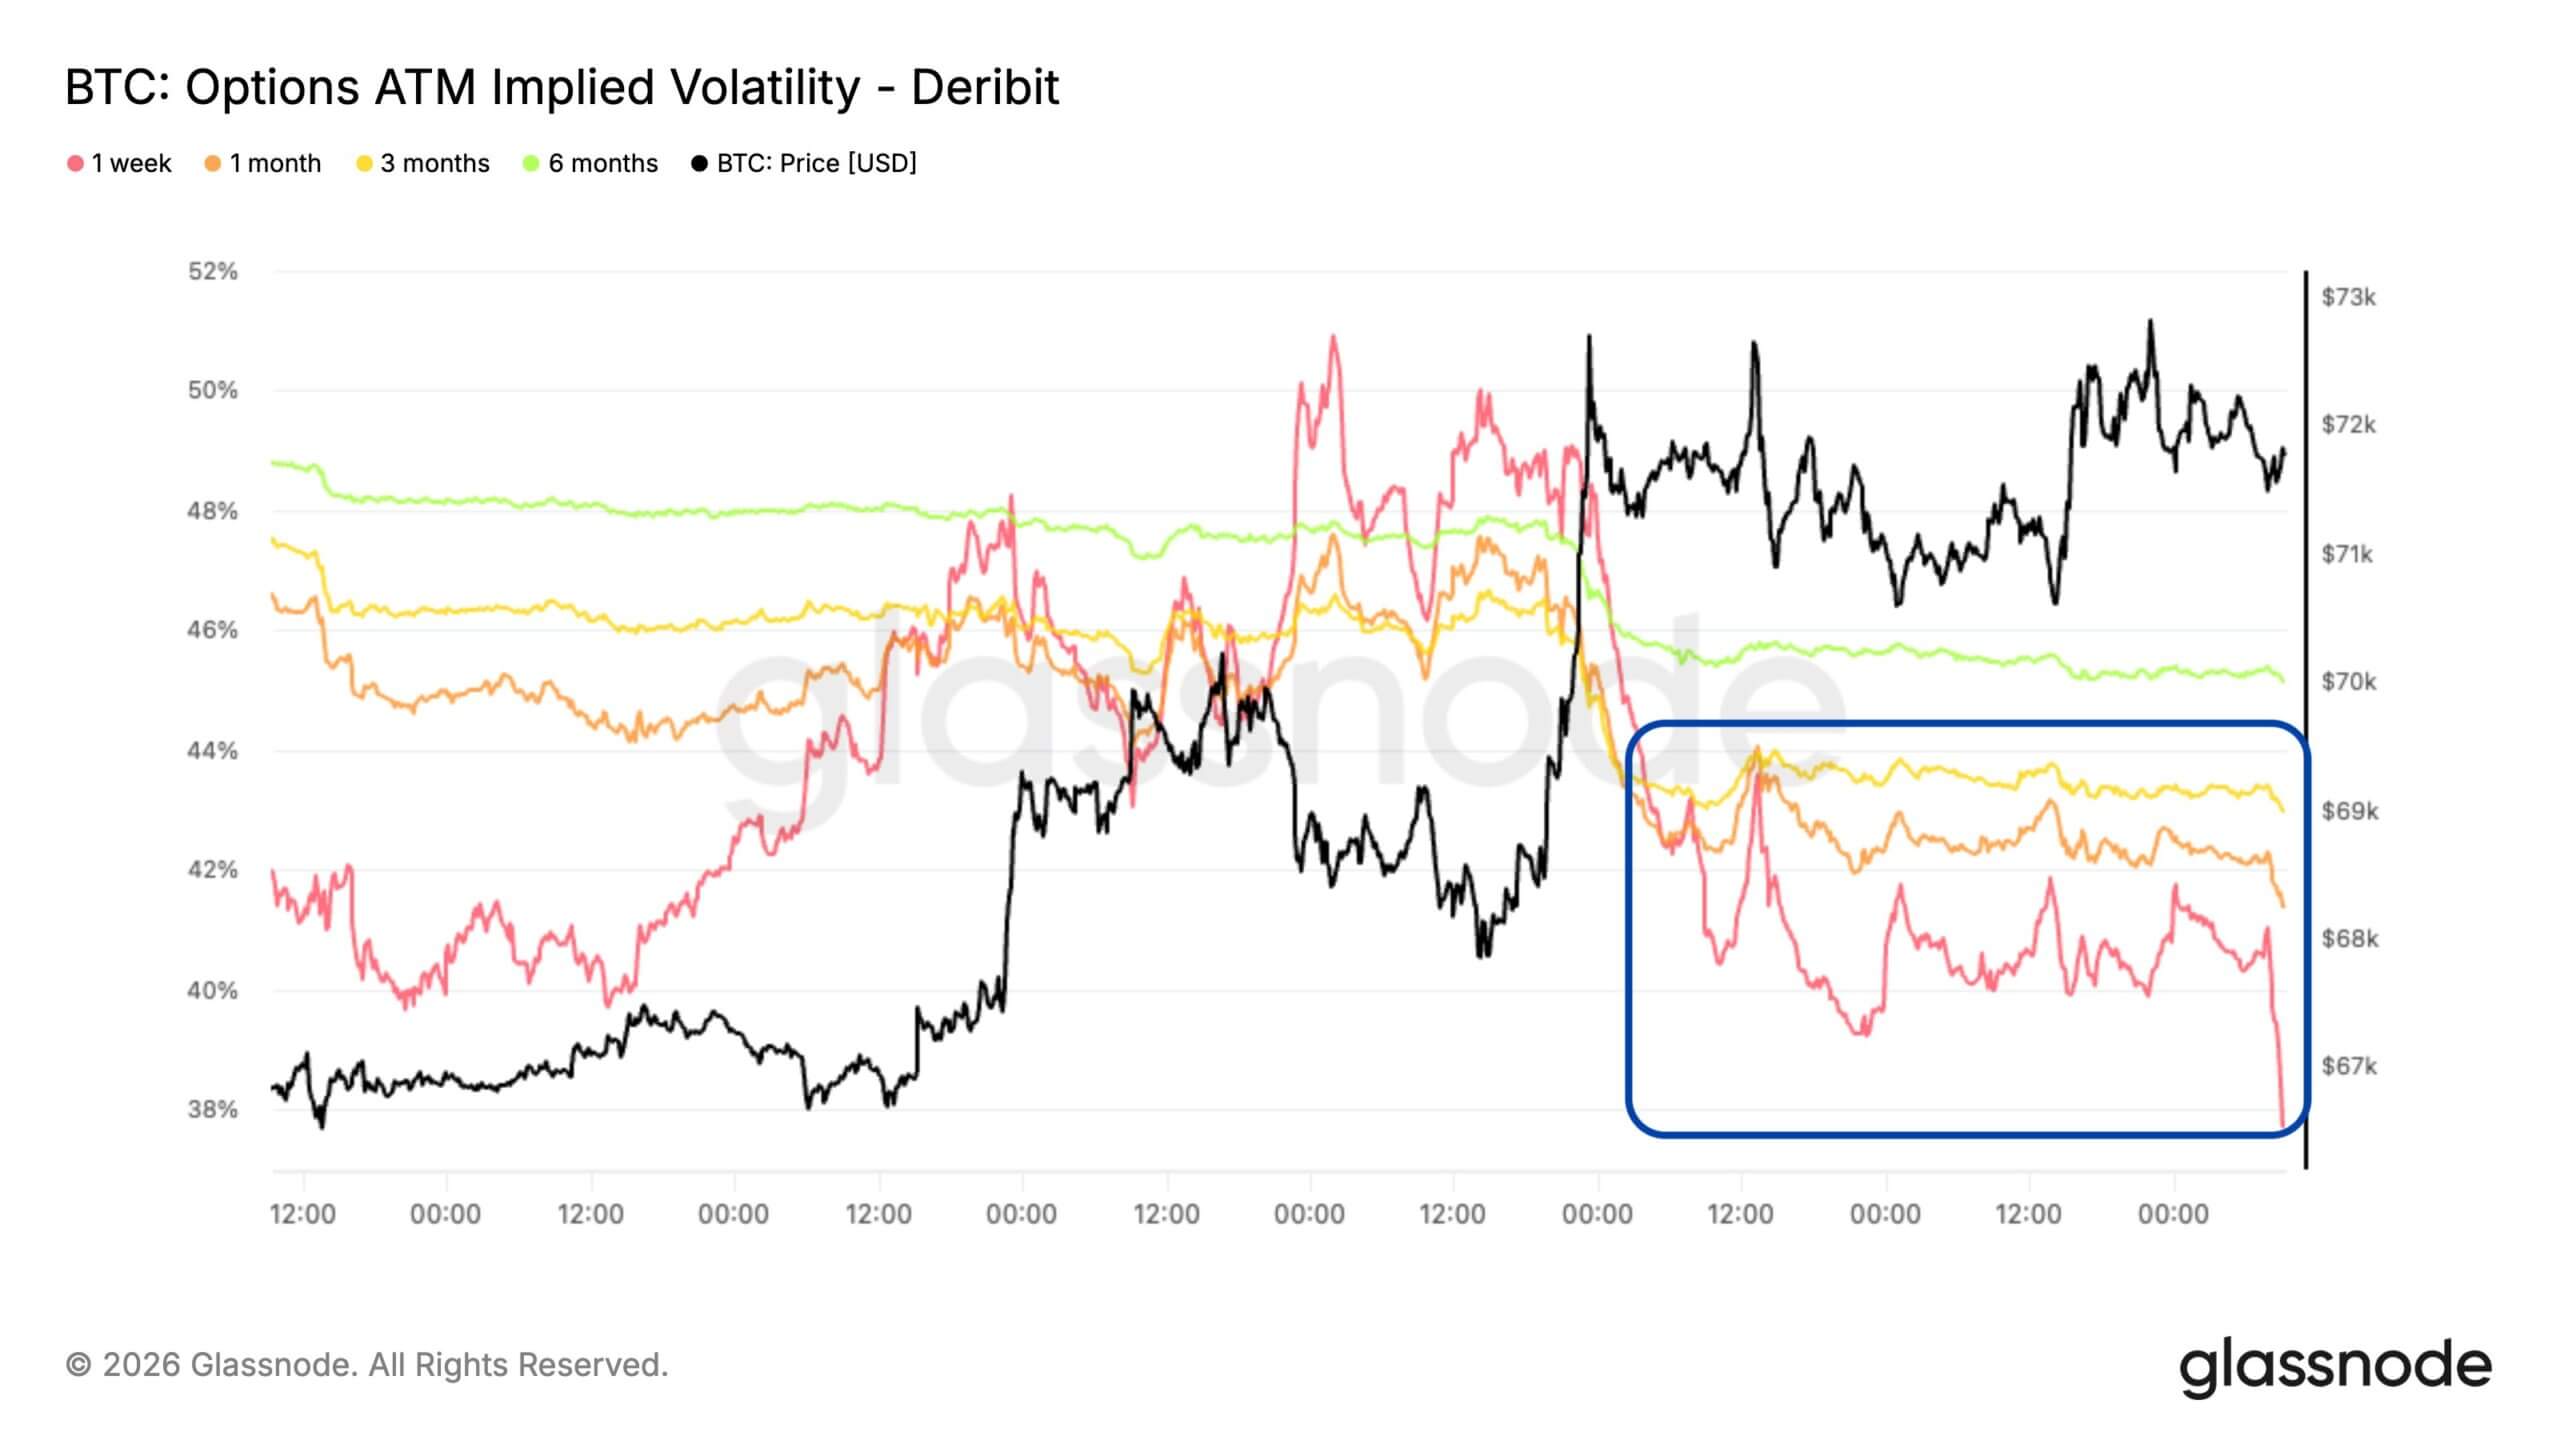
The firm said the ceasefire reinforced expectations for a quieter short-term backdrop, even though overall positioning remains light and cheaper options could draw fresh activity into upcoming macro events.
Ceasefire relief eases one pressure point
The macro backdrop helps explain why the crypto market was willing to shift into more bullish bets.
Market observers noted that Bitcoin’s recent recovery came alongside a move lower in oil after the temporary ceasefire between the United States and Iran reduced fears of a deeper supply shock in the Middle East. Lower oil prices eased one of the more immediate inflation risks facing global markets and helped steady sentiment across risk assets.
For Bitcoin, the move mattered because the market had spent weeks trading more like a macro-sensitive asset. Traders were watching oil, bond yields, and Fed expectations alongside crypto-specific indicators.

So, a pause in geopolitical escalation gave them a reason to reduce some of the defensive positioning that had built up during the conflict.
However, the macro picture is still mixed. The latest US consumer price index showed inflation at 3.3%, the highest since May 2024, while the monthly index rose 0.9%, the largest increase since mid-2022.
Those figures kept pressure on expectations for aggressive Fed easing. Markets are now pricing about a 30% chance of at least a quarter-point rate cut in December.
These developments leave enough room for relief rallies when geopolitical pressure eases, and oil stops driving the inflation debate higher.
Bitcoin’s options market appears to be trading that window. The concentration of interest at $80,000, $85,000, and even $100,000 reflects a market willing to price a test of higher levels if macro pressure continues to fade. On-chain price models help explain why those strikes are drawing attention.
Glassnode’s key reference levels place the active investors’ mean at $85,000, the short-term holder cost basis at $81,300, and the true market mean at around $78,000.
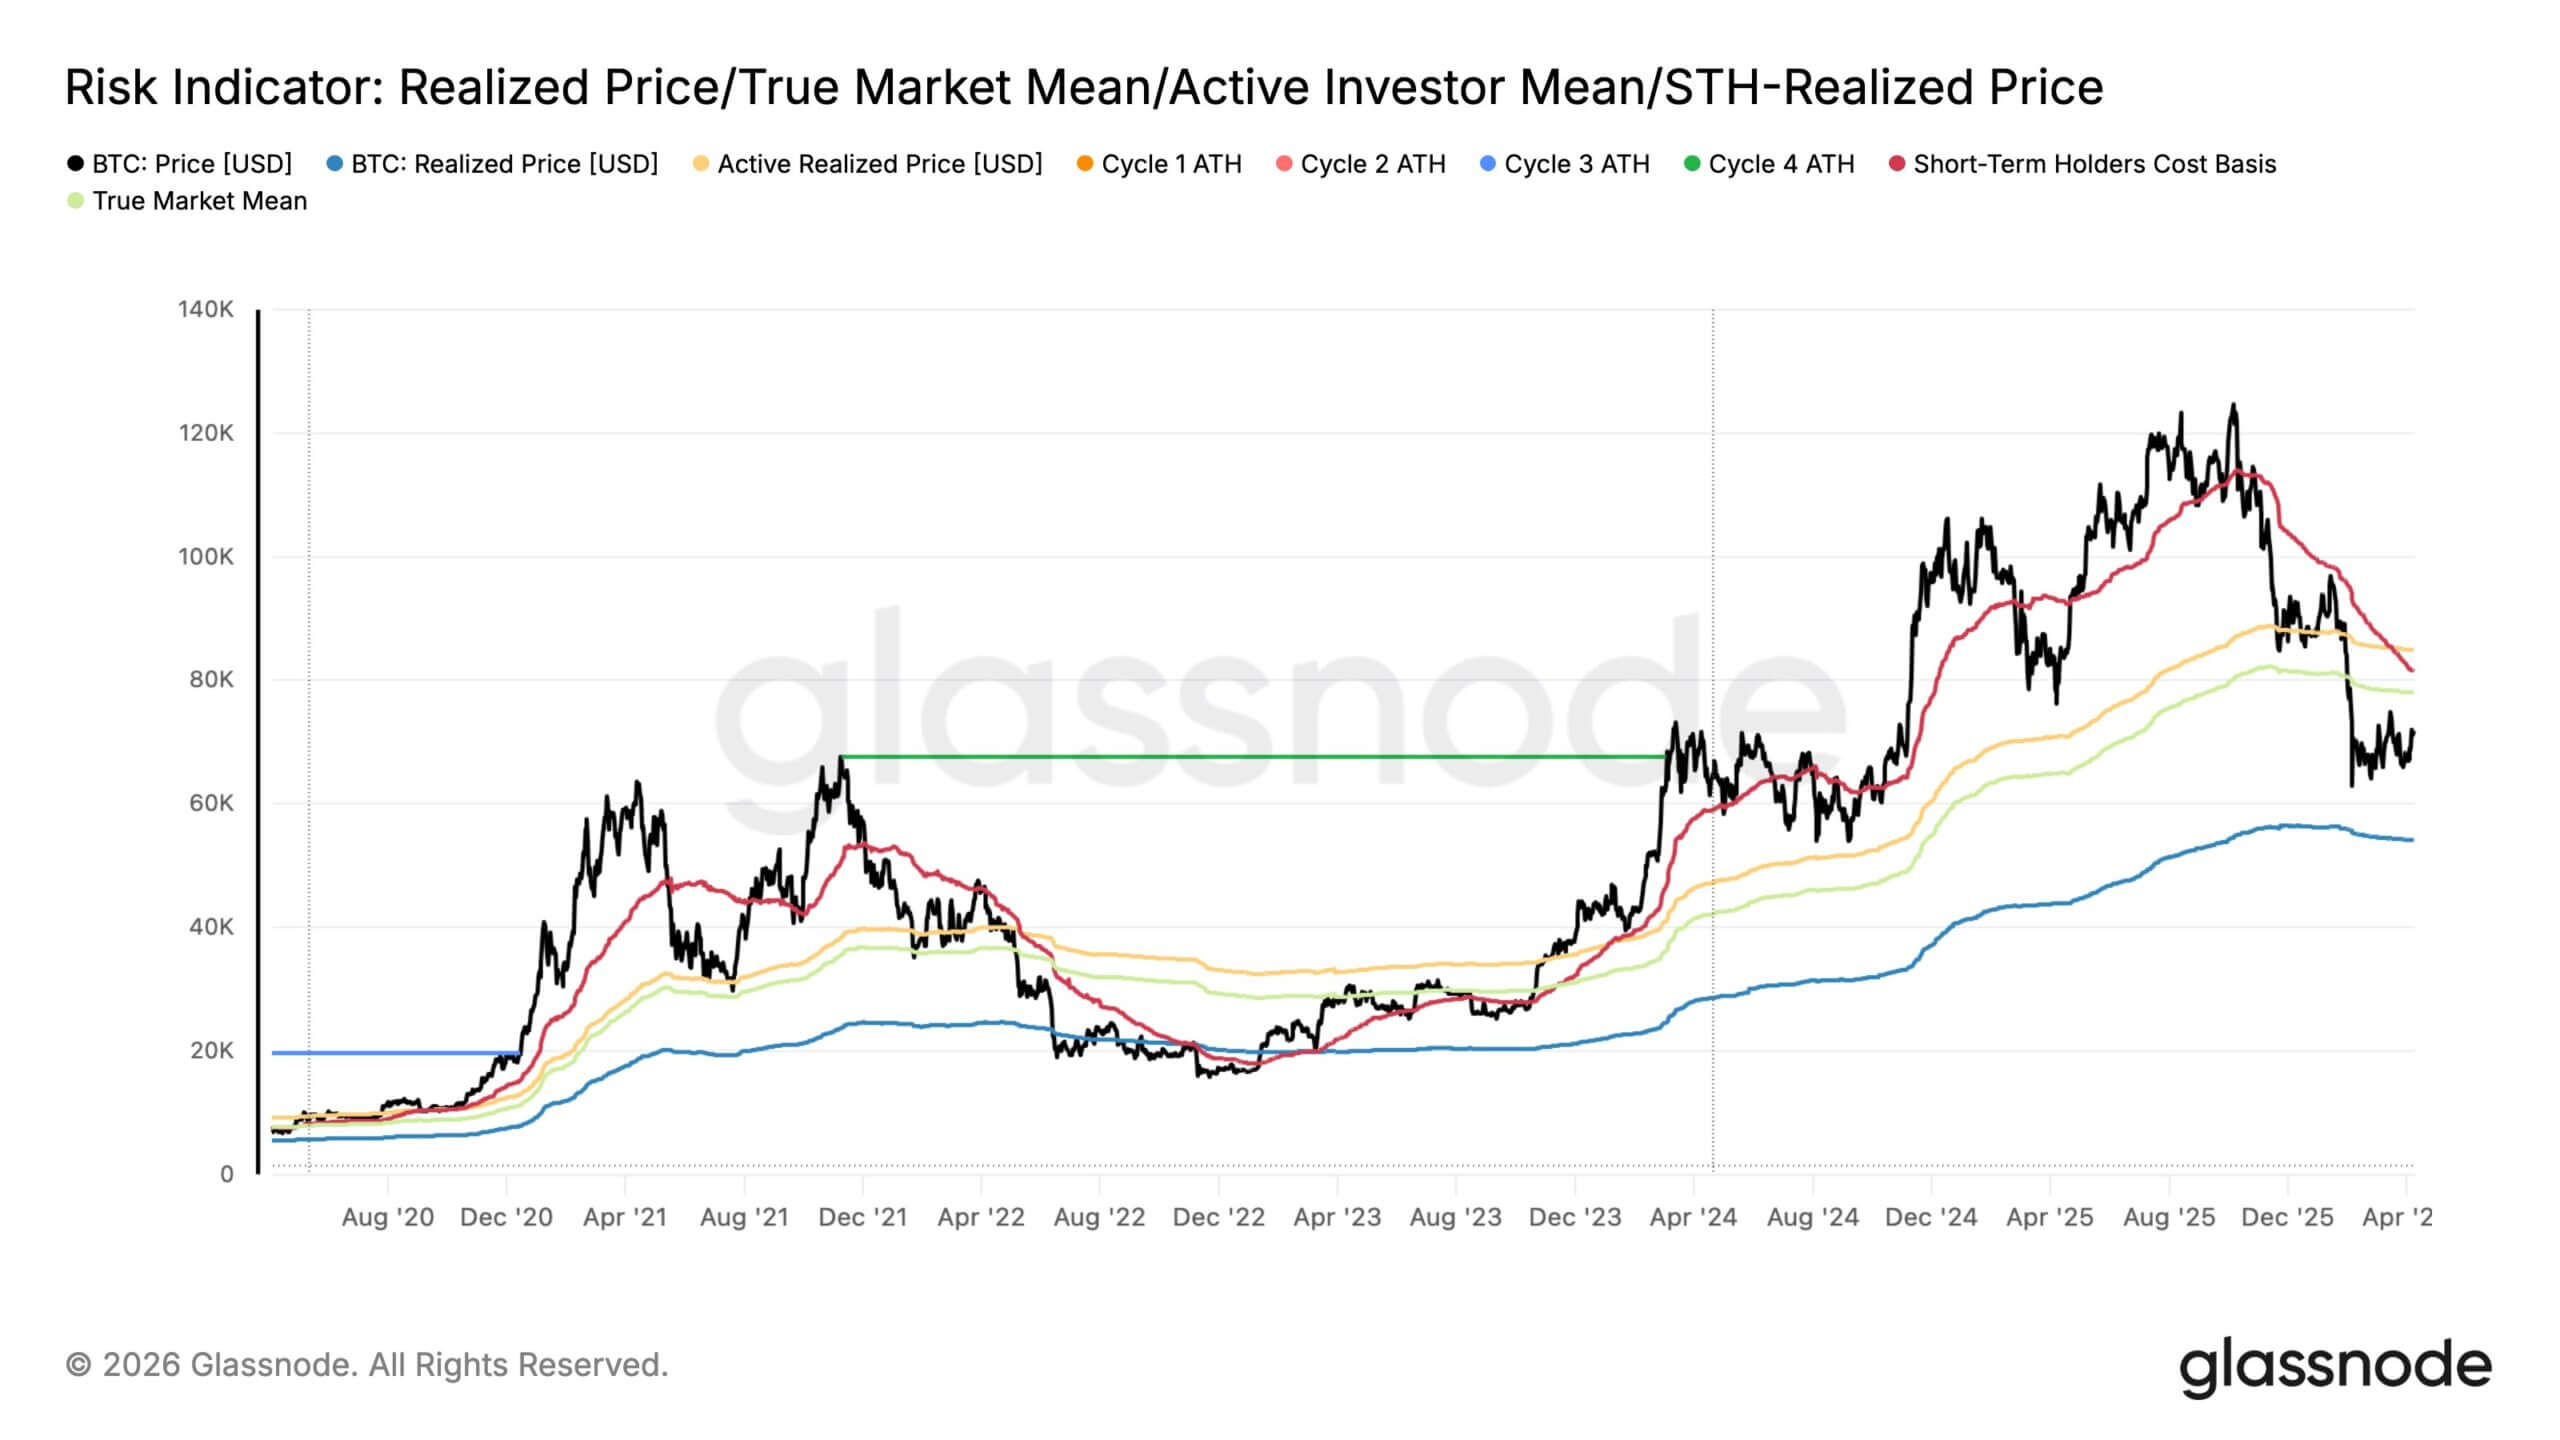
With spot recently around $71,800, those levels form a dense band of overhead resistance and potential price discovery if buyers keep pushing. Realized price, by contrast, sits much lower at $54,200, showing how far the market remains above aggregate cost basis even after the latest drawdown.
Essentially, that cluster between $78,000 to $85,000 helps explain why $80,000 has become a focal point. It sits in the middle of a zone where several market-wide cost bases begin to converge.
Bitcoin’s on-chain data still point to a repair phase
However, the bullish turn in options does not settle the broader argument over where Bitcoin sits in the cycle.
Joao Wedson, founder of blockchain analytics firm Alphractal, said one of his key signals still points to the risk of another leg lower before a more durable advance takes hold.
He highlighted the crossover of investor price below the long-term holder realized price, a structure he said has historically appeared during extended accumulation phases rather than at the start of renewed momentum.
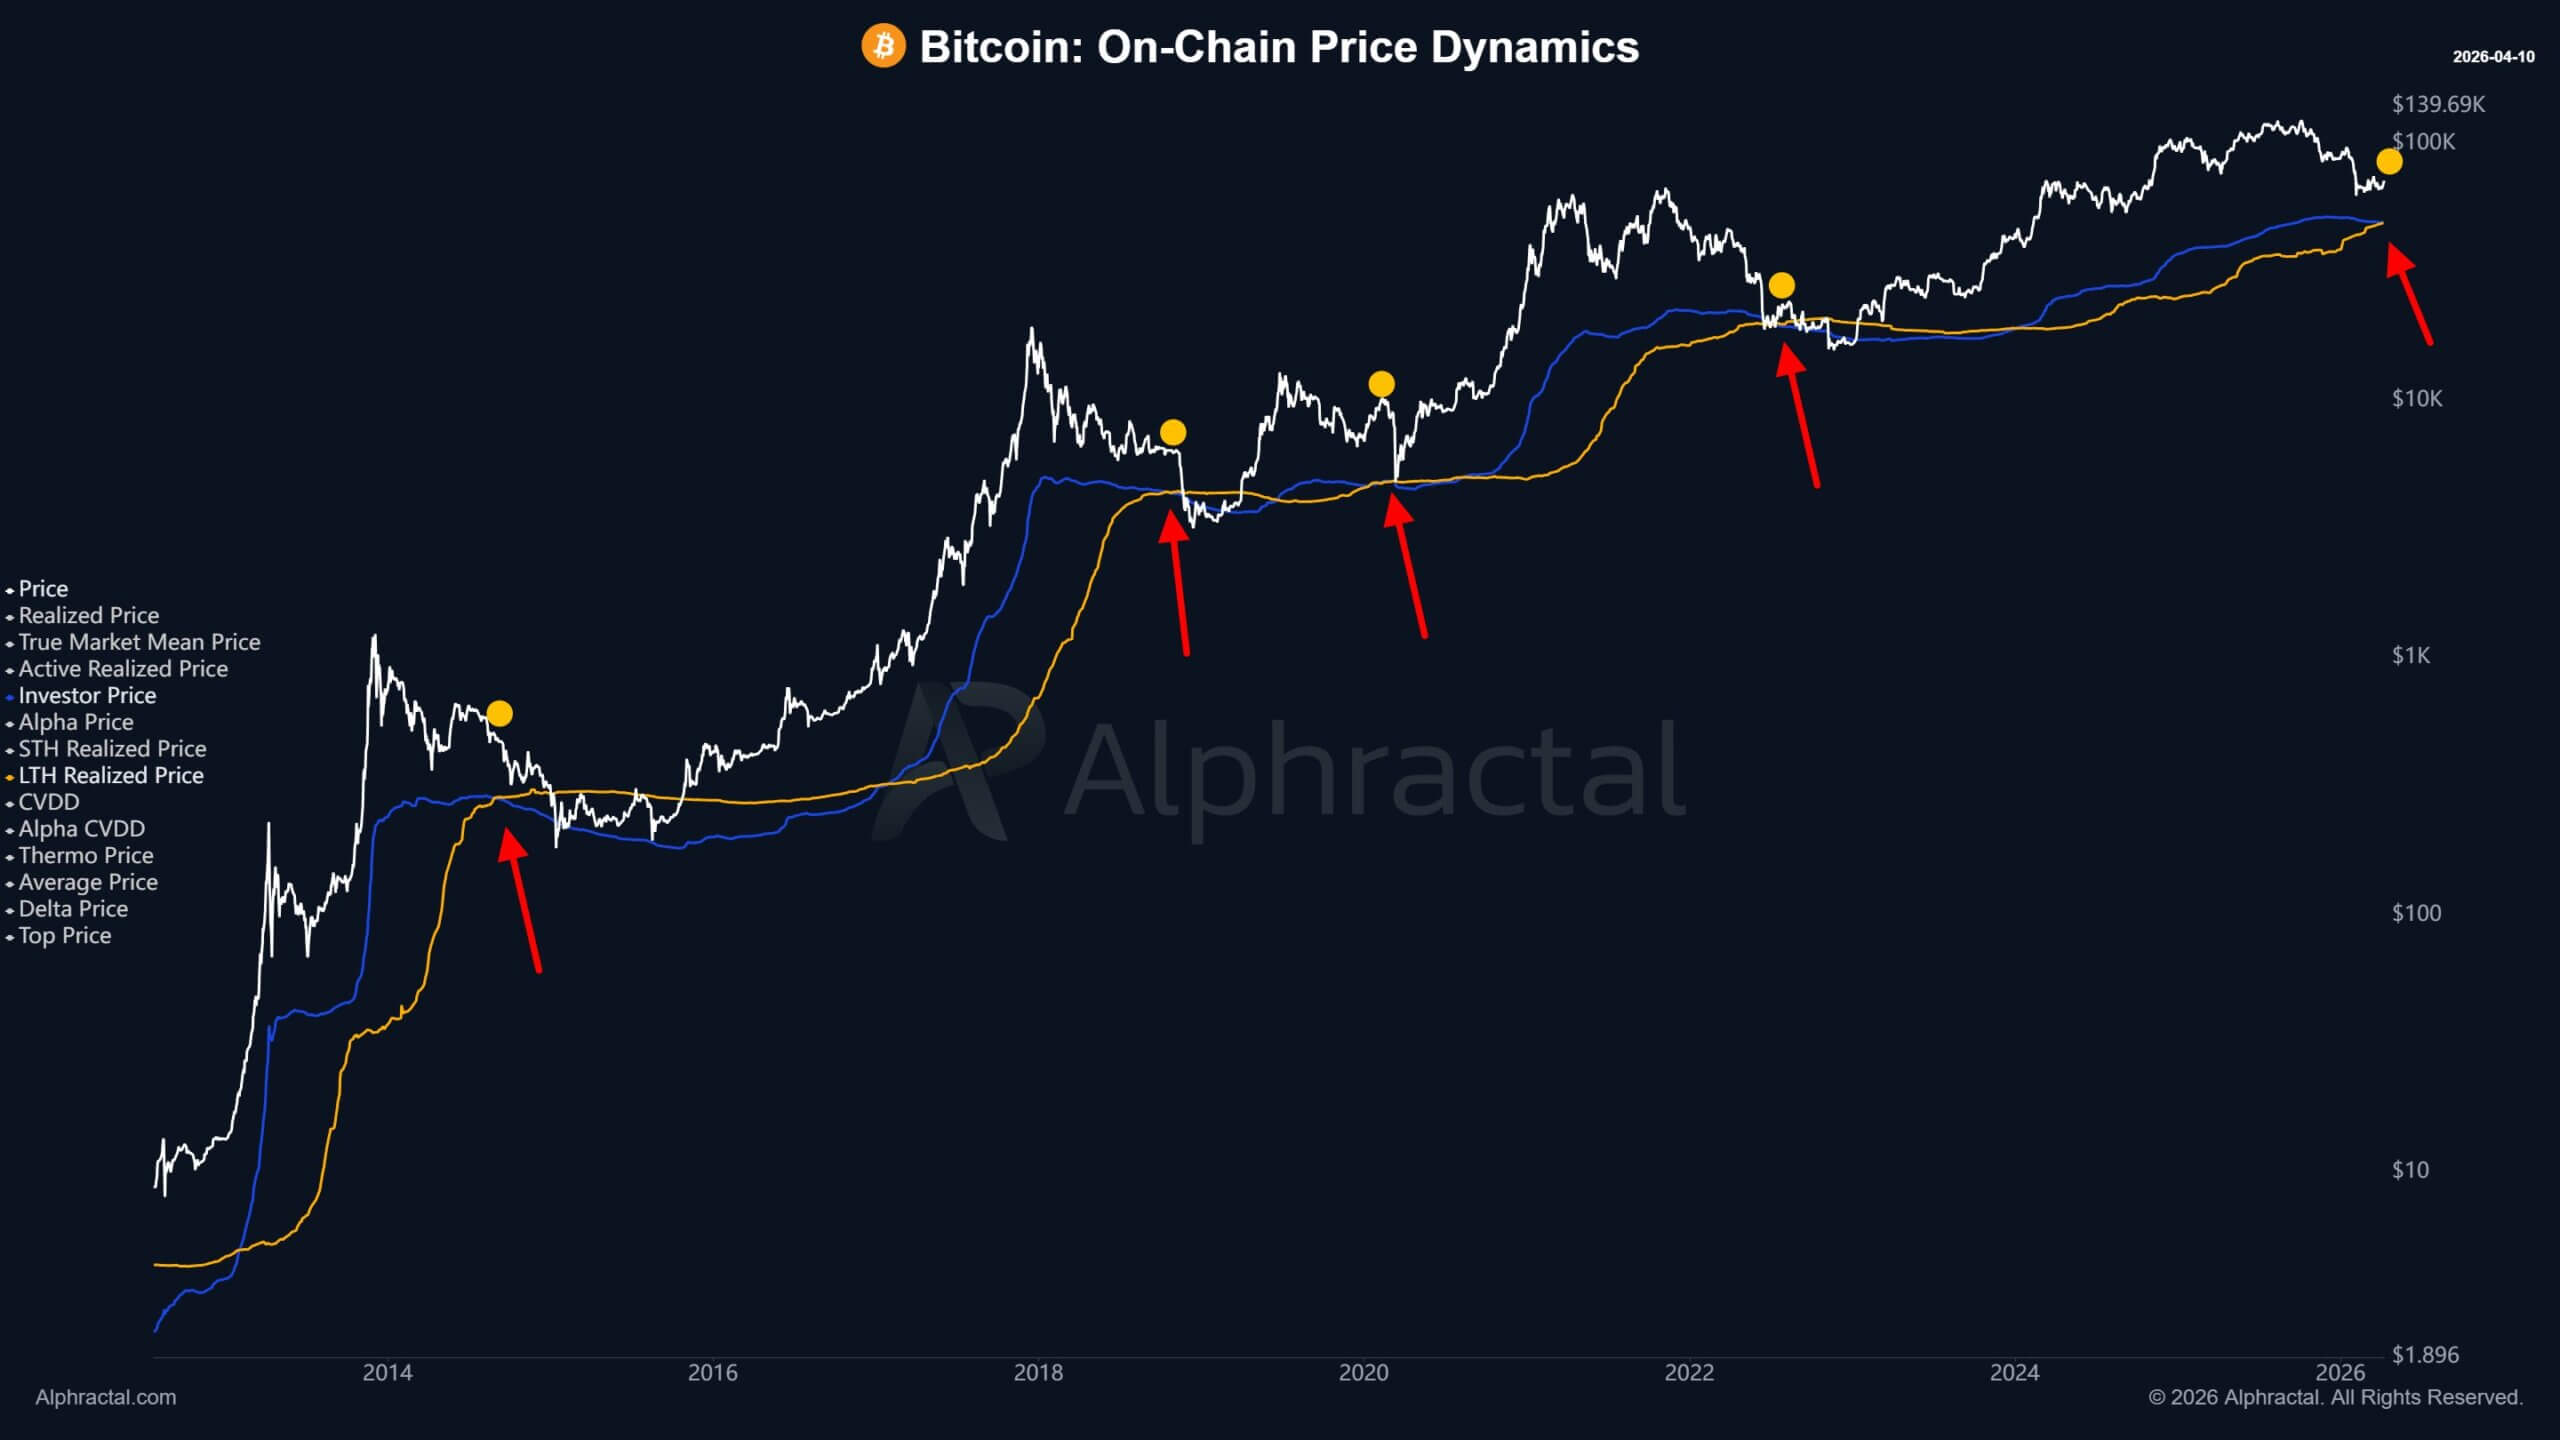
In practice, that means newer and more active capital has accepted lower prices than long-term holders paid. When that happens, market control tends to shift away from speculative participants and toward holders with longer time horizons.
This means that volatility can slow, but upside also becomes harder to sustain because rallies run into supply from investors trying to exit closer to breakeven.
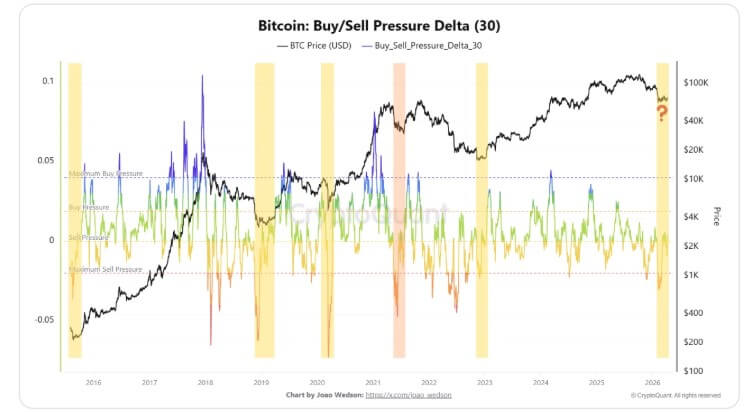
CryptoQuant described the current period in similar terms. The firm’s data show that the stress conditions in Bitcoin appear to be easing, but demand has not yet reasserted itself strongly enough to mark a clean reversal.
The blockchain firm stated that BTC’s buy-and-sell pressure delta has moved off extreme sell levels, a sign that capitulation may be fading, yet it has not yet reclaimed buy-pressure territory. That leaves the market in the gap between forced selling and fresh directional demand.
Moreover, BTC’s derivatives positioning also remains far from one-sided. Glassnode said the seven-day taker flow has become more balanced, but it still leans negative due to short calls and long puts.
This means that BTC rallies continue to attract hedging activity at higher levels, while bursts of strength are still being used to sell upside.
Notably, the top asset’s gamma positioning shows a similar split. Long gamma between $69,000 and $70,000 offers near-term support around the spot price.
Above that, a larger pocket of short gamma sits overhead. If support fails, the market could move quickly back toward the mid-$60,000s as hedging flows accelerate in the other direction.
Can Bitcoin reach $80,000?
If Bitcoin is to make a sustained run toward $80,000, options positioning alone is unlikely to be enough. The rally will need support from spot flows, particularly through ETFs and wealth-management channels that can absorb supply over a longer window.
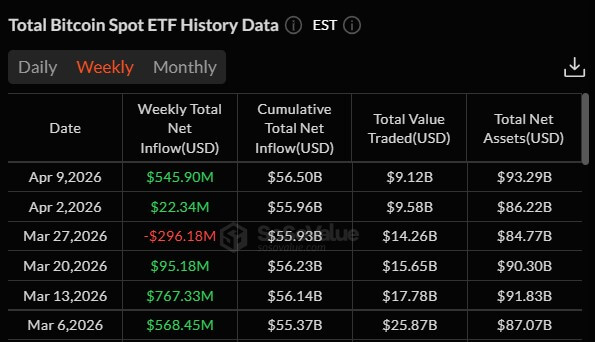
That support has begun to improve. Data from SoSoValue show that US spot Bitcoin ETFs are on pace for their largest weekly inflow in five weeks, taking in $545.9 million over the past week.
Morgan Stanley’s new Bitcoin ETF has added to that momentum after drawing more than $46 billion in inflows over its first two trading days, with Bloomberg ETF analyst Eric Balchunas projecting the fund could gather more than $5 billion in assets within its first year.
Morgan Stanley’s reach gives that launch broader significance. The bank’s 16,000 financial advisers oversee about $6.2 trillion in assets, creating a distribution channel that few rivals can match.
So, these flows indicate that institutional investors are again willing to add BTC exposure rather than waiting for every geopolitical risk to disappear first.
Still, that does not mean the path is clear for BTC. CryptoQuant’s data show that futures positioning on Binance, the largest crypto exchange by trading volume, is growing, with bearish bets increasing.
According to the firm, open interest on Binance rose by about $350 million over seven days, the largest increase since March 20, while cumulative net taker volume did not rise with the same strength.
That divergence can signal that a meaningful share of the new leverage is tied to short exposure or at least to a more cautious posture than the spot move alone would imply.
In other words, the market is no longer positioned for immediate collapse, but it is not unified behind a breakout either.
Notably, crypto traders on prediction markets reflect the same divide. On Polymarket, users assign a 26% chance that Bitcoin rises above $80,000 this month and a 9% chance that it reaches $85,000. However, more than 30% of the bettors still expect the token to return to about $65,000.
For now, the clearest message is that traders have begun to price a higher ceiling. The $80,000 strike has become the focal point of that view, supported by recent price rebound, lower macro stress, and improving institutional flows.
The hesitation that remains in skew, futures positioning, and on-chain data suggests the market still wants proof. Until that proof arrives, Bitcoin’s push higher is likely to remain a recovery trade first and a breakout second.
The post Bitcoin bulls are eyeing $100,000, yet the futures market hints at another dip first appeared first on CryptoSlate.
